How To Create State Diagrams with Graphviz
I love software design documentation. There’s just something fulfilling about seeing a coherent and simplistic representation of the behavior of a software system that sets my mind at ease. State diagrams are an especially common method of documenting software design but they’re not always easy to generate. If you have money, you can buy Visio and lay everything out manually. If you don’t have money you can download Dia or some other free/open-source software to (hopefully) do the same work as Visio. My experience with Visio is mostly frustration: aligning, centering, copying, arranging, etc. I usually spend 80% of my time on picky detail work rather than useful software design. That’s why I found Graphviz.
Graphviz is a software package for visualizing directed graphs. It’s been around for at least 26 years and AT&T Labs developed it, so it has some gravitas. You can download it for Windows, Linux or (as I am using right now) Cygwin and many other operating systems. The idea behind it is that you write a text file that defines all of the nodes in the graph and the edges that connect them together. Then, you can dress those nodes up with colors, styles, labels, etc. You take this text file, pass it through a command-line utility and Graphviz will lay out the diagram and produce a graphic file (which can be many many different formats).
Here I’ll lay out the steps to generate a basic state diagram with Graphviz. These steps assume that you have a working installation. I may document the installation steps at some future point.
Graphviz File
The directed graph/state diagram is defined entirely in a Graphviz file. Here is sample content for such a file - we’ll call it example.gv:
//C-style comments can be added

/* Multi-line comments are
 * valid too
 * Note: Lines end with a semicolon
 */

/* This line defines what kind of graph we're making ('digraph'=directed graph)
 * and the name of the digraph ('finite_state_machine')
 */

digraph finite_state_machine {
	//Define the nodes/states in the system and their style here


	/*These are the entry and exit nodes for the system.
	 * They are small, solid black circles.
	 * Both are listed on the same line because they all have the same properties
	 */

	node [shape=point,label=""]ENTRY,EXIT;

	//This line defines a new node style: the circle

	node [shape=circle];

	/* All the nodes defined here will be circles. Additional attributes defined
	 * for each node will be added on to the attributes listed above.
	 */

	 A[label="A"];		//Label attributes are placed inside the node

	 B[label="Node\nB"];	//Newlines are allowed in labels

	 C[label="C"];

	 //Below are all of the definition of the edges that connect the nodes

	 //Edges can have labels too

	 ENTRY->A [label="Initialization"];
	 A->B;
	 B->A;
	 A->C;
	 C->EXIT[label="Shutdown"];

}
You can use the following command line to generate a PNG file from this code:
dot example.gv -Tpng -o example.png
And it produces this output:
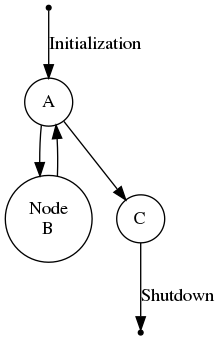
All of the tedium of laying out the states, drawing connections, etc. is done for you. Trust me: it’s not always this pretty or easy. Sometimes you get some downright insane diagrams from this process - especially for complex diagrams with lots of states, transitions and labels. There are methods you can use to tame the madness but they’re all beyond the scope of this article. Additionally, there are plenty of options for prettying up the graphs with colors, different node and edge styles, etc. Those are similarly beyond the scope of this article. Check out the link to the offical documentation in the Resources section below for full (and I do mean FULL) documentation on Graphviz and the DOT language.
Additional Constructs
This section contains information on how to generate other constructs within GraphViz.
Clusters
Clusters are groups of nodes that are all grouped, optionally with a border surrounding them and a label.
Here’s what a cluster looks like:
And how to create one:
digraph finite_state_machine {

	node [shape=point,label=""]ENTRY,EXIT;

   	//The A,B and C nodes are all grouped within a cluster

    //Note: In order to get the border and label, your subgraph name MUST begin with 'cluster'

	subgraph cluster1 {
        label="cluster1";
        node [shape=circle];
	    color=blue;
        A[label="A"];		//Label attributes are placed inside the node

	    B[label="Node\nB"];	//Newlines are allowed in labels

	    C[label="C"];
    }

	 ENTRY->A [label="Initialization"];
	 A->B;
	 B->A;
	 A->C;
	 C->EXIT[label="Shutdown"];

}
}
Points With Labels
For entry and exits from my graphs, I like to use the ‘point’ style node. However, you can’t add a label to point nodes. You’ll have to do this:
digraph finite_state_machine {

	node [shape=circle,style=filled,color=black,width=.05,fixedsize=true]
    ENTRY[xlabel="Entry"];
    EXIT[xlabel="Exit"];
	ENTRY->EXIT

}
Note the use of ‘xlabel’ on those nodes is due to the fact that a regular ‘label’ will attempt to place the label text inside of the node, which is not really possible for a point.
Moving Labels
Sometimes the labels (especially on the points with labels above) can be in a bad place.
xlabel
If the label is an xlabel, there’s really no good way to move it. You might have luck adding some newlines before or after the label, or some spaces, but that’s about it.
Cluster Label
As per this SO answer, you can use a location command (labelloc) to change the location of the label:
digraph finite_state_machine {

	subgraph cluster1 {
        label="myLabel" labelloc="b"];
        node [shape=circle,style=filled,color=black,width=.05,fixedsize=true]
        ENTRY[xlabel="Entry"];
        EXIT[xlabel="Exit"];
        ENTRY->EXIT

}